Shrinkflation in charts
By ShrinkRadar · Updated 2026-11-05 · Redrawn from the case library and the ShrinkRadar Index on every build
Four charts you can share: download the PNG, copy a link to a chart, or paste it into a blog post. Every figure comes from our 1,366 documented shrinkflation cases, each linked to the consumer agency, advocate or newspaper that reported it. For the full tables see shrinkflation statistics and the ShrinkRadar Index.
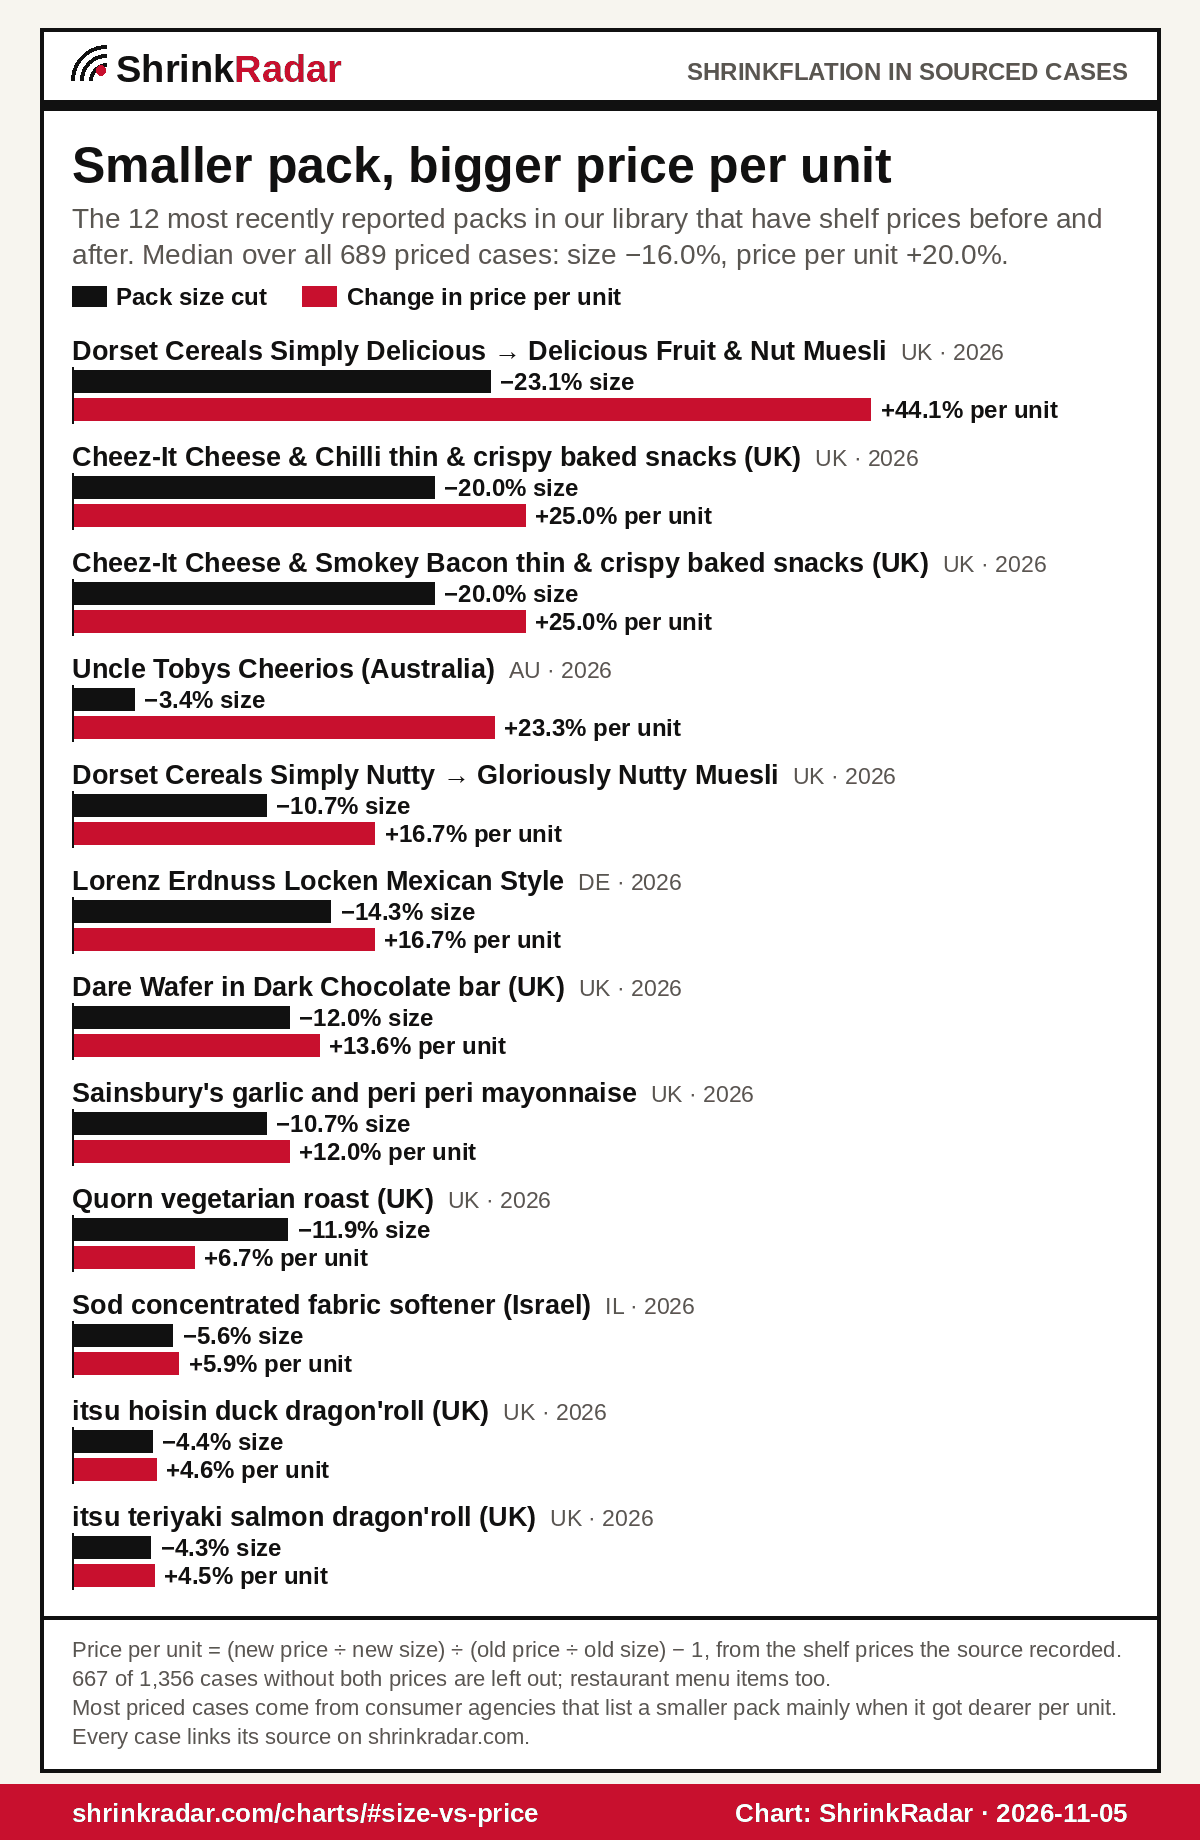
Smaller pack, bigger price per unit
Each pair is one product: how much the pack shrank (ink) and how much its price per gram, millilitre or sheet changed (red), using the shelf prices the source recorded. These are the 12 most recently reported priced cases, not the most extreme ones, sorted by the price change. Across all 689 priced cases (2015–2026), the median pack lost 16.0% and the median price per unit rose 20.0%; in 25% the shelf price went up too, so the per-unit rise beat the size cut alone.
- Priced cases
- 689 of 1,356
- Median size cut
- −16.0%
- Median price per unit
- +20.0%
- Shelf price also went up
- 25% (172)
Pack size cut Change in price per unit (shelf prices recorded by the source)
The numbers (table)
| Product | Size | Size cut | Price per unit |
|---|---|---|---|
| Dorset Cereals Simply Delicious → Delicious Fruit & Nut Muesli United Kingdom 2026 | 650 g → 500 g | −23.1% | +44.1% |
| Cheez-It Cheese & Chilli thin & crispy baked snacks (UK) United Kingdom 2026 | 150 g → 120 g | −20.0% | +25.0% |
| Cheez-It Cheese & Smokey Bacon thin & crispy baked snacks (UK) United Kingdom 2026 | 150 g → 120 g | −20.0% | +25.0% |
| Uncle Tobys Cheerios (Australia) Australia 2026 | 580 g → 560 g | −3.4% | +23.3% |
| Dorset Cereals Simply Nutty → Gloriously Nutty Muesli United Kingdom 2026 | 560 g → 500 g | −10.7% | +16.7% |
| Lorenz Erdnuss Locken Mexican Style Germany 2026 | 175 g → 150 g | −14.3% | +16.7% |
| Dare Wafer in Dark Chocolate bar (UK) United Kingdom 2026 | 50 g → 44 g | −12.0% | +13.6% |
| Sainsbury's garlic and peri peri mayonnaise United Kingdom 2026 | 280 ml → 250 ml | −10.7% | +12.0% |
| Quorn vegetarian roast (UK) United Kingdom 2026 | 454 g → 400 g | −11.9% | +6.7% |
| Sod concentrated fabric softener (Israel) Israel 2026 | 900 ml → 850 ml | −5.6% | +5.9% |
| itsu hoisin duck dragon'roll (UK) United Kingdom 2026 | 203 g → 194 g | −4.4% | +4.6% |
| itsu teriyaki salmon dragon'roll (UK) United Kingdom 2026 | 184 g → 176 g | −4.3% | +4.5% |
Scope: 689 of 1,356 documented pack cases have both shelf prices; the other 667 are left out (we never estimate a price), as are restaurant menu items. Most priced cases come from German and Dutch consumer agencies, which list a smaller pack mainly when it got dearer per unit, so this shows how big hidden rises are, not how often a shrink is fair. The table also shows the rise the size cut implies if the price had stayed the same (not drawn). Method: Index method · about our sources. Generated 5 Nov 2026. Chart: ShrinkRadar.
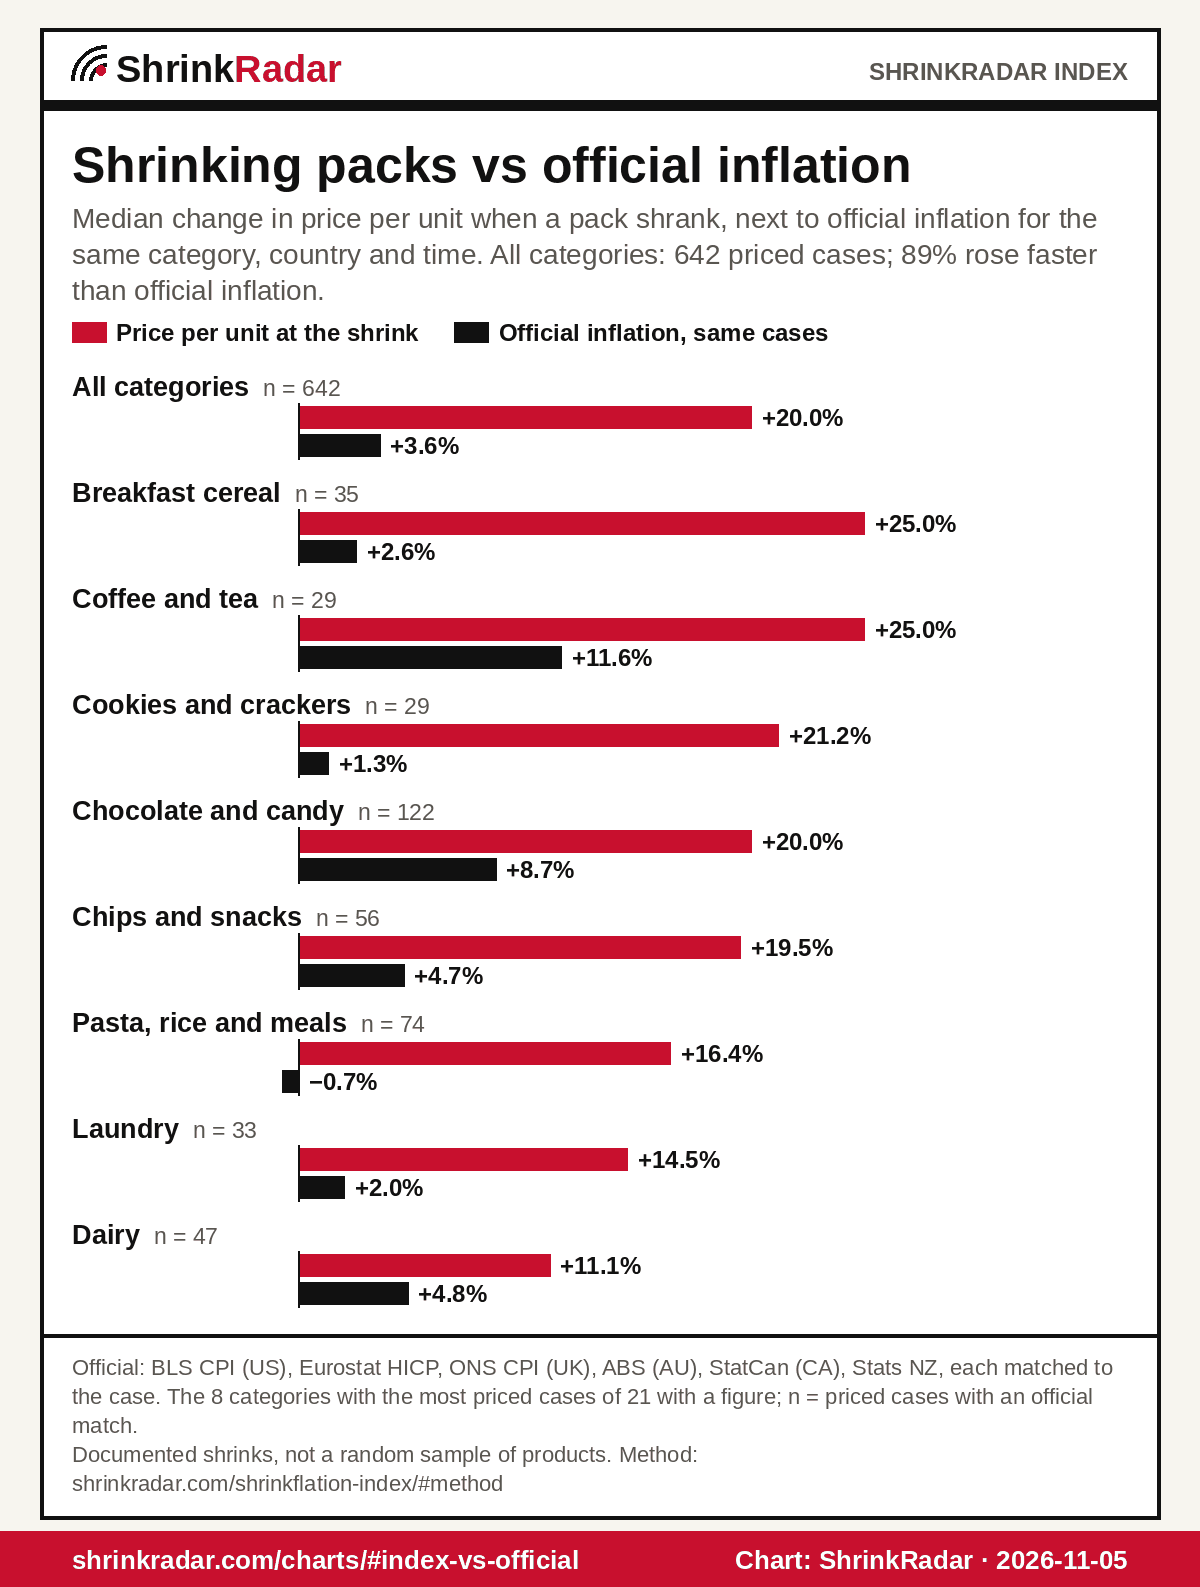
Shrinking packs vs official inflation
The ShrinkRadar Index puts the per-unit price change of each documented shrink next to the official inflation rate for the same category, country and time. Across all categories the median is +20.0% per unit against +3.6% official inflation (642 priced cases with an official match), and 89% of those cases rose faster than the official rate.
Price per unit at the shrink (median) Official inflation, same cases (median)(n) = priced cases with an official match
The numbers (table)
| Category | Priced cases with an official match | Per unit (median) | Official, same cases |
|---|---|---|---|
| All categories | 642 | +20.0% | +3.6% |
| Breakfast cereal | 35 | +25.0% | +2.6% |
| Coffee and tea | 29 | +25.0% | +11.6% |
| Cookies and crackers | 29 | +21.2% | +1.3% |
| Chocolate and candy | 122 | +20.0% | +8.7% |
| Chips and snacks | 56 | +19.5% | +4.7% |
| Pasta, rice and meals | 74 | +16.4% | −0.7% |
| Laundry | 33 | +14.5% | +2.0% |
| Dairy | 47 | +11.1% | +4.8% |
Scope: the 8 categories with the most priced cases, of 21 with a figure (at least 5 cases); every category is on the Index page. Cases since 2018. Not compared with an unmatched headline CPI. Method: Index method and limits. Generated 5 Nov 2026. Chart: ShrinkRadar.
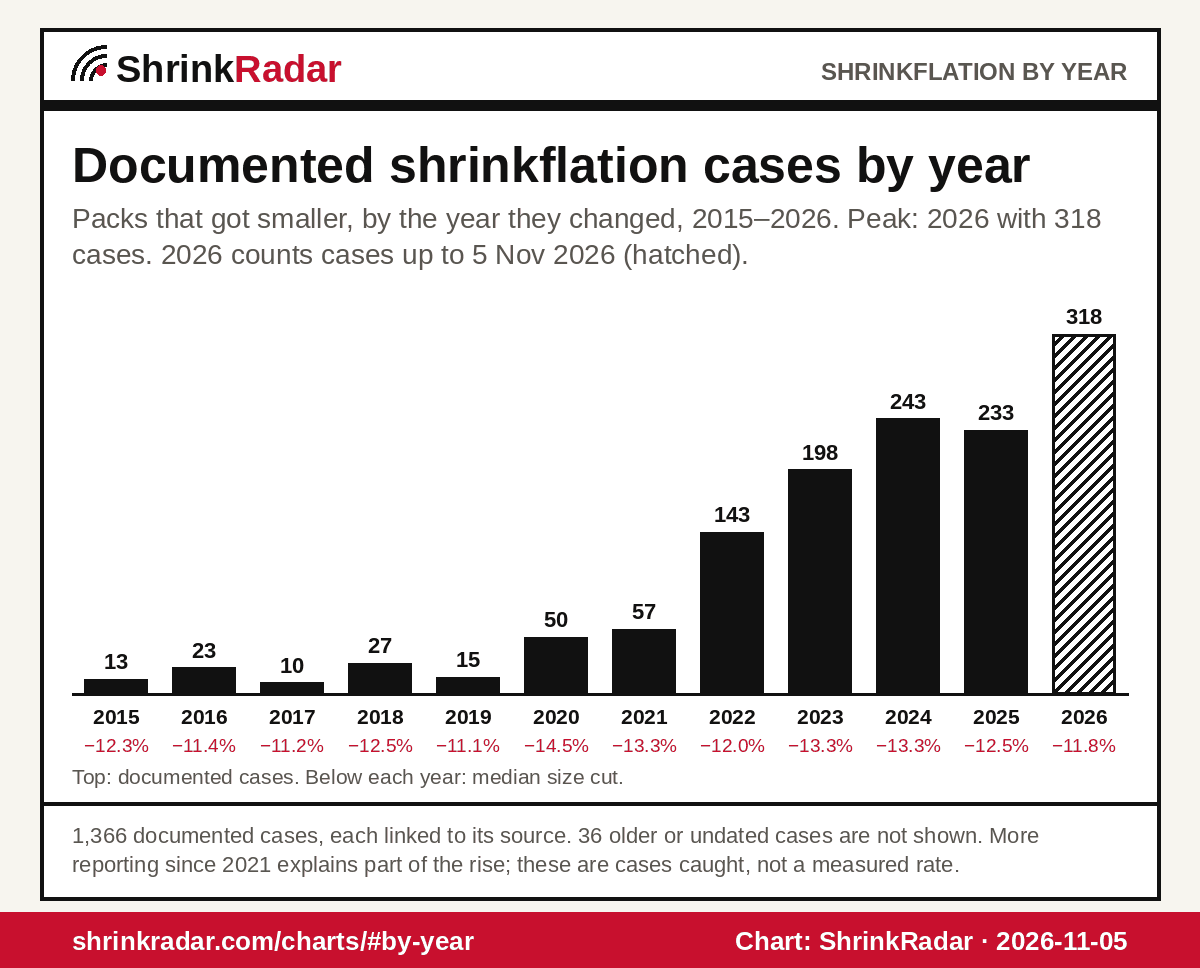
Documented cases by year
Packs that got smaller, by the year they changed (or were reported). Documented cases peak in 2026 with 318. Part of the rise is more reporting: consumer agencies and newspapers started tracking shrinkflation closely during the 2021–2023 inflation spike.
The numbers (table)
| Year | Cases | Median cut |
|---|---|---|
| 2015 | 13 | −12.3% |
| 2016 | 23 | −11.4% |
| 2017 | 10 | −11.2% |
| 2018 | 27 | −12.5% |
| 2019 | 15 | −11.1% |
| 2020 | 50 | −14.5% |
| 2021 | 57 | −13.3% |
| 2022 | 143 | −12.0% |
| 2023 | 198 | −13.3% |
| 2024 | 243 | −13.3% |
| 2025 | 233 | −12.5% |
| 2026 | 318 | −11.8% |
Scope: 1,366 documented cases; 36 from before 2015 or without a year are not shown. 2026 counts cases up to 5 Nov 2026. Method: how cases are counted. Generated 5 Nov 2026. Chart: ShrinkRadar.
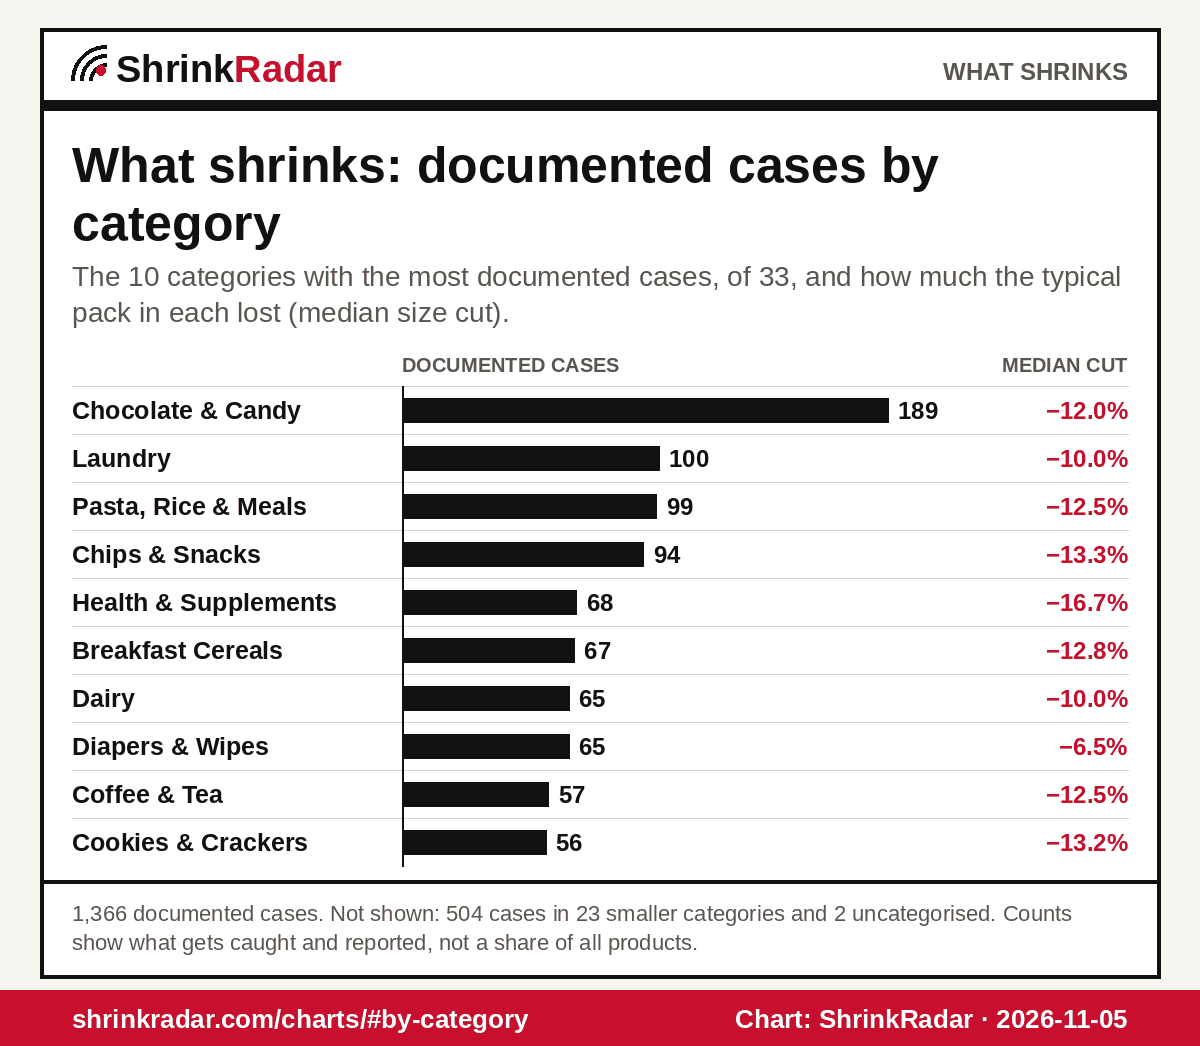
What shrinks: cases by category
The 10 categories with the most documented cases. Chocolate & Candy leads with 189. Bars count cases; the median cut is how much the typical pack in that category lost.
| Category | Cases | Median cut |
|---|---|---|
| Chocolate & Candy | 189 | −12.0% |
| Laundry | 100 | −10.0% |
| Pasta, Rice & Meals | 99 | −12.5% |
| Chips & Snacks | 94 | −13.3% |
| Health & Supplements | 68 | −16.7% |
| Breakfast Cereals | 67 | −12.8% |
| Dairy | 65 | −10.0% |
| Diapers & Wipes | 65 | −6.5% |
| Coffee & Tea | 57 | −12.5% |
| Cookies & Crackers | 56 | −13.2% |
Scope: 1,366 documented cases; 504 in 23 smaller categories and 2 uncategorised are not shown. These counts show what gets caught and reported, not how common shrinkflation is in each category. All categories: statistics · category pages. Generated 5 Nov 2026. Chart: ShrinkRadar.
Reuse
Free to share, print or post with credit: “Chart: ShrinkRadar (shrinkradar.com/charts/)”. Please link the chart. The charts are aggregates and selected public cases; each case links its original source. To check a single product, search or see all cases.
Cite as: ShrinkRadar, “Shrinkflation in charts”, https://shrinkradar.com/charts/, accessed 2026-11-05.