ShrinkRadar Index: hidden inflation in shrinking packs
By ShrinkRadar · Updated 2026-11-05 · Recomputed from the case library and official price data on every build
When a pack shrinks, its price per gram, sheet or load jumps. The ShrinkRadar Index measures that jump in 1,275 documented shrinkflation cases since 2018 and puts it next to the official inflation rate (US CPI from the Bureau of Labor Statistics, Eurostat HICP for euro-area and Nordic cases, ONS CPI for UK cases, ABS, Statistics Canada and Stats NZ CPI for Australian, Canadian and New Zealand cases) for the same category, country and time.
same category, country and time+3.6%
573 of 64289%
median, all 1,275 cases since 2018+14.3%
16 priced cases; official +3.3%+15.2%
141 priced cases with an official match; official +1.8%+16.0%
Official data: BLS CPI to Sep 2026, Eurostat HICP to Sep 2026, ONS CPI (UK) to Sep 2026, ABS CPI (Australia) to Q3 2026, StatCan CPI (Canada) to Sep 2026, Stats NZ CPI (New Zealand) to Q3 2026. Recomputed on every build. Method · Changes since 4 Nov.
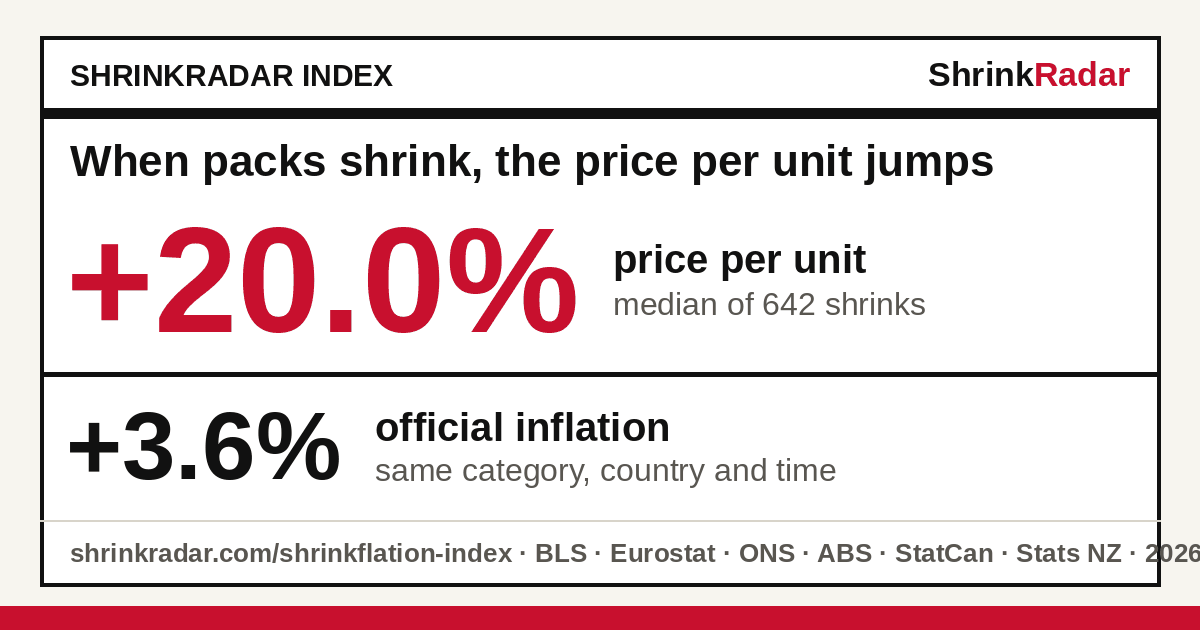
How to read this: take the 642 packs that shrank, have a shelf price from before and after the cut, and have an official inflation figure to compare with. Per gram, sheet or load, half of them cost at least 20.0% more than the pack they replaced (that is the median); official inflation for the same kind of product, country and time was +3.6%. 573 of the 642 rose faster than the official rate. The size cut alone, if the shelf price had stayed the same, adds a median +14.3% per unit across all 1,275 cases since 2018.
The index in one line
Each line is computed from the tables below. Copy one with its source.
Packs that shrank cost a median 20.0% more per unit than the pack they replaced, while official inflation for the same category, country and time was 3.6% (642 priced cases with an official match, 2018–2026).
In 89% of those cases (573 of 642), the price per unit rose more than the official inflation rate for that category.
In the UK, packs that shrank cost a median 17.2% more per unit, while ONS consumer price inflation for the same categories at the same time was 3.3% (102 priced cases with an official match, 2018–2026).
Show all 23 lines (20 more: by country, period and category)
In Australia, packs that shrank cost a median 44.7% more per unit, while ABS consumer price inflation for the same categories over the same period was 29.6% (10 priced cases with an official match, 2026).
In New Zealand, packs that shrank cost a median 9.5% more per unit, while Stats NZ consumer price inflation for the same categories over the same period was 4.8% (6 priced cases with an official match, 2026).
In Germany, packs that shrank cost a median 20.0% more per unit, while Eurostat HICP inflation for the same categories over the same period was 3.8% (404 priced cases with an official match, 2018–2026, mostly from Verbraucherzentrale Hamburg).
In the Netherlands, packs that shrank cost a median 12.0% more per unit, while Eurostat HICP inflation for the same categories over the same period was 1.6% (68 priced cases with an official match, 2024–2026).
In the United States, packs that shrank cost a median 40.7% more per unit, while BLS consumer price inflation (CPI-U) for the same categories over the same period was 26.8% (32 priced cases with an official match, 2022–2024, mostly from LendingTree shrinkflation study).
In Spain, packs that shrank cost a median 33.1% more per unit, while Eurostat HICP inflation for the same categories over the same period was 18.0% (9 priced cases with an official match, 2023–2025, mostly from El Cronista).
In Austria, packs that shrank cost a median 20.0% more per unit, while Eurostat HICP inflation for the same categories over the same period was 1.5% (7 priced cases with an official match, 2023–2024).
In the last 12 months (Nov 2025–Oct 2026), packs that shrank cost a median 16.0% more per unit, against 1.8% official inflation for the same cases (141 priced cases with an official match; 138 of them beat the official rate); in the 12 months before (Nov 2024–Oct 2025) it was 21.6% against 4.1% (74 cases).
Chocolate and candy is up 8.7% officially, up 20.0% per unit (median of 122 documented cases, 2019–2026, official rate matched to each case).
Pasta, rice and meals is down 0.7% officially, up 16.4% per unit (median of 74 documented cases, 2019–2026, official rate matched to each case).
Chips and snacks is up 4.7% officially, up 19.5% per gram (median of 56 documented cases, 2018–2026, official rate matched to each case).
Dairy is up 4.8% officially, up 11.1% per unit (median of 47 documented cases, 2020–2026, official rate matched to each case).
Breakfast cereal is up 2.6% officially, up 25.0% per gram (median of 35 documented cases, 2020–2026, official rate matched to each case).
Laundry is up 2.0% officially, up 14.5% per unit (median of 33 documented cases, 2020–2026, official rate matched to each case).
In the US, breakfast cereal is up 24.3% officially (CPI breakfast cereal, 2024 average vs 2019–2020 average), up 45.0% per ounce in the packs that shrank (median of 6 cases).
In the US, toilet paper is up 28.8% officially (CPI household paper products, 2024 average vs 2019–2020 average), up 30.4% per sheet in the packs that shrank (median of 6 cases).
In the US, chips and snacks is up 21.1% officially (CPI snacks, matched to each case), up 76.6% per ounce in the packs that shrank (median of 5 cases).
In the US, chocolate and candy is up 28.7% officially (CPI candy and chewing gum, 2024 average vs 2019–2020 average), up 64.3% per ounce in the packs that shrank (median of 5 cases).
In the US, paper towels is up 28.8% officially (CPI household paper products, 2024 average vs 2019–2020 average), up 25.8% per sheet in the packs that shrank (median of 5 cases).
In the US, the size cut alone raised the price per unit by a median 12.4% (222 US cases, 2018–2026); US CPI for the same categories at the same time rose a median 3.8%.
By month
Each bar is the median change in price per unit among cases reported that month that have shelf prices before and after. A month needs at least 5 priced cases; 30 months since January 2020 had fewer and show no bar. The lines are official 12-month food inflation in the US and in Germany, where most monthly cases come from.
ShrinkRadar Index: median change in price per unit, cases reported that month US CPI food at home, 12-month change Germany HICP food, 12-month change
Monthly figures (table, newest first)
| Month reported | Cases | Priced | Per unit (median) | Official, same cases (n) | |
|---|---|---|---|---|---|
| Nov 2026 | 1 | 0 | Too few priced cases (minimum 5) | ||
| Oct 2026 | 50 | 16 | +15.2% | +3.3% (15) | |
| Sep 2026 | 16 | 10 | +17.5% | +1.5% (10) | |
| Aug 2026 | 15 | 15 | +11.4% | +0.5% (15) | |
| Jul 2026 | 32 | 18 | +10.3% | +1.4% (17) | |
| Jun 2026 | 32 | 14 | +15.8% | +0.6% (13) | |
| May 2026 | 43 | 36 | +17.0% | +2.3% (33) | |
| Apr 2026 | 15 | 12 | +19.1% | +1.2% (10) | |
| Mar 2026 | 16 | 10 | +8.8% | +0.7% (10) | |
| Feb 2026 | 8 | 3 | Too few priced cases (minimum 5) | ||
| Jan 2026 | 21 | 7 | +25.0% | +10.4% (7) | |
| Dec 2025 | 10 | 6 | +30.7% | +12.2% (6) | |
| Nov 2025 | 6 | 4 | Too few priced cases (minimum 5) | ||
| Oct 2025 | 7 | 4 | Too few priced cases (minimum 5) | ||
| Sep 2025 | 22 | 8 | +27.5% | +3.3% (8) | |
| Aug 2025 | 7 | 6 | +11.2% | +2.3% (6) | |
| Jul 2025 | 29 | 9 | +16.7% | +3.1% (9) | |
| Jun 2025 | 12 | 12 | +21.1% | +16.9% (12) | |
| May 2025 | 12 | 0 | Too few priced cases (minimum 5) | ||
| Apr 2025 | 9 | 9 | +37.9% | +11.6% (9) | |
| Mar 2025 | 23 | 7 | +33.3% | −0.9% (7) | |
| Feb 2025 | 34 | 9 | +18.5% | +9.5% (7) | |
| Jan 2025 | 10 | 3 | Too few priced cases (minimum 5) | ||
| Dec 2024 | 21 | 6 | +18.8% | +10.0% (5) | |
| Nov 2024 | 5 | 5 | +21.3% | too few (4) | |
| Oct 2024 | 40 | 20 | +32.8% | +0.3% (19) | |
| Sep 2024 | 7 | 7 | +25.5% | +2.5% (7) | |
| Aug 2024 | 23 | 6 | +20.0% | +0.3% (6) | |
| Jul 2024 | 1 | 1 | Too few priced cases (minimum 5) | ||
| Jun 2024 | 10 | 7 | +16.3% | +1.6% (7) | |
| May 2024 | 11 | 7 | +27.7% | +1.9% (7) | |
| Apr 2024 | 18 | 7 | +20.0% | +5.6% (7) | |
| Mar 2024 | 5 | 5 | +10.0% | +1.3% (5) | |
| Feb 2024 | 6 | 5 | +18.2% | −1.0% (5) | |
| Jan 2024 | 6 | 1 | Too few priced cases (minimum 5) | ||
| Dec 2023 | 23 | 8 | +20.6% | +3.0% (7) | |
| Nov 2023 | 8 | 8 | +32.9% | +4.6% (8) | |
| Oct 2023 | 9 | 8 | +13.4% | +9.7% (8) | |
| Sep 2023 | 15 | 6 | +22.5% | +11.7% (6) | |
| Aug 2023 | 5 | 5 | +25.0% | +9.6% (5) | |
| Jul 2023 | 6 | 6 | +25.1% | +9.6% (6) | |
| Jun 2023 | 13 | 13 | +20.0% | +15.5% (12) | |
| May 2023 | 29 | 16 | +21.1% | +13.8% (15) | |
| Apr 2023 | 6 | 6 | +13.9% | +17.3% (6) | |
| Mar 2023 | 15 | 9 | +25.0% | +23.0% (7) | |
| Feb 2023 | 6 | 6 | +17.1% | +23.8% (5) | |
| Jan 2023 | 4 | 2 | Too few priced cases (minimum 5) | ||
| Dec 2022 | 6 | 6 | +31.3% | +34.7% (6) | |
| Nov 2022 | 6 | 6 | +16.7% | +21.5% (6) | |
| Oct 2022 | 3 | 3 | Too few priced cases (minimum 5) | ||
| Sep 2022 | 22 | 15 | +16.7% | +14.2% (13) | |
| Aug 2022 | 16 | 16 | +14.8% | +14.8% (16) | |
| Jul 2022 | 7 | 7 | +13.6% | +6.9% (7) | |
| Jun 2022 | 16 | 10 | +19.6% | +12.2% (10) | |
| May 2022 | 10 | 4 | Too few priced cases (minimum 5) | ||
| Apr 2022 | 3 | 3 | Too few priced cases (minimum 5) | ||
| Mar 2022 | 11 | 9 | +11.1% | +7.4% (9) | |
| Feb 2022 | 1 | 0 | Too few priced cases (minimum 5) | ||
| Dec 2021 | 3 | 0 | Too few priced cases (minimum 5) | ||
| Nov 2021 | 2 | 2 | Too few priced cases (minimum 5) | ||
| Oct 2021 | 1 | 1 | Too few priced cases (minimum 5) | ||
| Sep 2021 | 4 | 4 | Too few priced cases (minimum 5) | ||
| Aug 2021 | 10 | 2 | Too few priced cases (minimum 5) | ||
| Jul 2021 | 4 | 4 | Too few priced cases (minimum 5) | ||
| Jun 2021 | 4 | 4 | Too few priced cases (minimum 5) | ||
| May 2021 | 16 | 14 | +17.7% | +1.5% (14) | |
| Apr 2021 | 2 | 2 | Too few priced cases (minimum 5) | ||
| Mar 2021 | 2 | 2 | Too few priced cases (minimum 5) | ||
| Feb 2021 | 4 | 4 | Too few priced cases (minimum 5) | ||
| Dec 2020 | 6 | 2 | Too few priced cases (minimum 5) | ||
| Nov 2020 | 3 | 3 | Too few priced cases (minimum 5) | ||
| Sep 2020 | 3 | 3 | Too few priced cases (minimum 5) | ||
| Aug 2020 | 4 | 2 | Too few priced cases (minimum 5) | ||
| Jul 2020 | 3 | 3 | Too few priced cases (minimum 5) | ||
| Jun 2020 | 6 | 6 | +21.0% | +2.3% (6) | |
| May 2020 | 5 | 5 | +20.0% | too few (4) | |
| Apr 2020 | 3 | 3 | Too few priced cases (minimum 5) | ||
| Mar 2020 | 3 | 0 | Too few priced cases (minimum 5) | ||
| Feb 2020 | 6 | 6 | +29.2% | +0.9% (6) | |
| Jan 2020 | 5 | 5 | +13.6% | +1.3% (5) | |
By category
Per-unit change at the shrink against official inflation for the same cases: each case is matched to the official series for its category and country at the time it changed, and both columns are medians over the same cases. Categories need at least 5 priced cases with an official match; 12 categories with fewer are listed at the bottom without figures.
Price per unit at the shrink (median) Official inflation, same cases (median)(n) = priced cases with an official match
| Category | Cases | Per unit (median) | Official, same cases | |
|---|---|---|---|---|
| Chocolate & Candy Topic guide | 183123 priced | +20.0% | +8.7% | |
| Pasta, Rice & Meals Topic guide | 9675 priced | +16.4% | −0.7% | |
| Chips & Snacks Topic guide | 9156 priced | +19.5% | +4.7% | |
| Dairy Topic guide | 6147 priced | +11.1% | +4.8% | |
| Breakfast Cereals Topic guide | 6535 priced | +25.0% | +2.6% | |
| Laundry Topic guide | 9637 priced | +14.5% | +2.0% | |
| Coffee & Tea Topic guide | 5332 priced | +25.0% | +11.6% | |
| Cookies & Crackers Topic guide | 5330 priced | +21.2% | +1.3% | |
| Meat & Fish Topic guide | 3927 priced | +19.3% | +3.0% | |
| Personal Care Topic guide | 2722 priced | +27.9% | +1.6% | |
| Soap, Shampoo & Body Wash Topic guide | 5124 priced | +21.4% | +1.9% | |
| Dish & Cleaning Topic guide | 4820 priced | +11.1% | +1.7% | |
| Juice & Drinks Topic guide | 3220 priced | +33.2% | +5.0% | |
| Frozen Foods Topic guide | 3420 priced | +16.9% | +3.8% | |
| Baking & Spreads Topic guide | 3614 priced | +25.1% | +2.8% | |
| Pet Food Topic guide | 3613 priced | +17.6% | +1.9% | |
| Bread & Bakery | 1411 priced | +16.0% | +1.6% | |
| Toilet Paper Topic guide | 289 priced | +29.4% | +28.8% | |
| Health & Supplements Topic guide | 5911 priced | +15.2% | +3.2% | |
| Ice Cream Topic guide | 176 priced | +9.5% | +6.6% | |
| Paper Towels Topic guide | 165 priced | +25.8% | +28.8% | |
| Diapers & Wipes Topic guide | 647 priced | No official series matched to these cases yet | ||
| Tobacco & Alcohol | 1614 priced | No official series matched to these cases yet | ||
| Oral Care Topic guide | 144 priced | 4 priced cases with an official match; needs 1 more (minimum 5) | ||
| Household Topic guide | 94 priced | 4 priced cases with an official match; needs 1 more (minimum 5) | ||
| Baby | 75 priced | 4 priced cases with an official match; needs 1 more (minimum 5) | ||
| Tissues | 74 priced | 4 priced cases with an official match; needs 1 more (minimum 5) | ||
| Bags, Foil & Wrap Topic guide | 60 priced | 0 priced cases with an official match; needs 5 more (minimum 5) | ||
| Feminine Care Topic guide | 53 priced | 3 priced cases with an official match; needs 2 more (minimum 5) | ||
| Shaving & Razors Topic guide | 52 priced | 2 priced cases with an official match; needs 3 more (minimum 5) | ||
| Deodorant Topic guide | 41 priced | 1 priced case with an official match; needs 4 more (minimum 5) | ||
| Other | 21 priced | No official series matched to these cases yet | ||
| Cat Litter & Pet Supplies Topic guide | 11 priced | 1 priced case with an official match; needs 4 more (minimum 5) | ||
Closest to a figure (priced cases with an official match now, of 5 needed): Baby 4, needs 1 more; Household 4, needs 1 more; Oral Care 4, needs 1 more; Tissues 4, needs 1 more; Feminine Care 3, needs 2 more; Shaving & Razors 2, needs 3 more; Cat Litter & Pet Supplies 1, needs 4 more; Deodorant 1, needs 4 more; Bags, Foil & Wrap 0, needs 5 more.
Category pages
One page per category with a figure: headline, quotable lines, by country and year, every case and its official match.
- Chocolate and candy →+20.0% per unit vs +8.7% official · 122 priced cases with an official match
- Pasta, rice and meals →+16.4% per unit vs −0.7% official · 74 priced cases with an official match
- Chips and snacks →+19.5% per unit vs +4.7% official · 56 priced cases with an official match
- Dairy →+11.1% per unit vs +4.8% official · 47 priced cases with an official match
- Breakfast cereal →+25.0% per unit vs +2.6% official · 35 priced cases with an official match
- Laundry →+14.5% per unit vs +2.0% official · 33 priced cases with an official match
- Coffee and tea →+25.0% per unit vs +11.6% official · 29 priced cases with an official match
- Cookies and crackers →+21.2% per unit vs +1.3% official · 29 priced cases with an official match
- Meat and fish →+19.3% per unit vs +3.0% official · 26 priced cases with an official match
- Personal Care →+27.9% per unit vs +1.6% official · 22 priced cases with an official match
- Soap, shampoo and body wash →+21.4% per unit vs +1.9% official · 22 priced cases with an official match
- Dish soap and cleaners →+11.1% per unit vs +1.7% official · 20 priced cases with an official match
- Juice and soft drinks →+33.2% per unit vs +5.0% official · 20 priced cases with an official match
- Frozen Foods →+16.9% per unit vs +3.8% official · 19 priced cases with an official match
- Baking goods and spreads →+25.1% per unit vs +2.8% official · 14 priced cases with an official match
- Pet Food →+17.6% per unit vs +1.9% official · 12 priced cases with an official match
- Bread and bakery →+16.0% per unit vs +1.6% official · 11 priced cases with an official match
- Toilet Paper →+29.4% per unit vs +28.8% official · 9 priced cases with an official match
- Health and supplements →+15.2% per unit vs +3.2% official · 8 priced cases with an official match
- Ice Cream →+9.5% per unit vs +6.6% official · 6 priced cases with an official match
- Paper Towels →+25.8% per unit vs +28.8% official · 5 priced cases with an official match
By country
The same comparison by the country the case comes from. Each country is benchmarked against its own statistics office: BLS CPI for the US, Eurostat HICP for euro-area countries and Norway, ONS CPI for the UK, ABS CPI for Australia, Statistics Canada CPI for Canada and Stats NZ CPI for New Zealand. Countries with fewer than 5 priced cases with an official match, or without official data loaded, show no figure. Most priced cases come from the German and Dutch consumer agencies, so those two countries dominate the overall median. Country trackers: Australia · Austria · France · Germany · Hungary · Israel · Italy · Japan · Netherlands · South Korea · United Kingdom · United States. Every country has a summary page under countries.
Price per unit at the shrink (median) Official inflation, same cases (median)(n) = priced cases with an official match
| Country | Cases | Per unit (median) | Official, same cases | |
|---|---|---|---|---|
| Germany | 419419 priced | +20.0% | +3.8% | |
| United Kingdom | 163103 priced | +17.2% | +3.3% | |
| Netherlands | 7373 priced | +12.0% | +1.6% | |
| United States | 23033 priced | +40.7% | +26.8% | |
| Australia | 3110 priced | +44.7% | +29.6% | |
| Spain | 149 priced | +33.1% | +18.0% | |
| Austria | 378 priced | +20.0% | +1.5% | |
| New Zealand | 126 priced | +9.5% | +4.8% | |
| France | 203 priced | Too few priced cases with an official match (3; minimum 5) | ||
| Ireland | 11 priced | Too few priced cases with an official match (1; minimum 5) | ||
| Hungary | 800 priced | No official series loaded for this country | ||
| Israel | 629 priced | No official series loaded for this country | ||
| Japan | 395 priced | No official series loaded for this country | ||
| South Korea | 311 priced | No official series loaded for this country | ||
| Italy | 200 priced | Too few priced cases with an official match (0; minimum 5) | ||
| Canada | 140 priced | Too few priced cases with an official match (0; minimum 5) | ||
| Brazil | 90 priced | No official series loaded for this country | ||
| India | 80 priced | No official series loaded for this country | ||
| Hong Kong | 41 priced | No official series loaded for this country | ||
| Switzerland | 20 priced | No official series loaded for this country | ||
| Europe | 20 priced | No official series loaded for this country | ||
| Norway | 22 priced | Too few priced cases with an official match (0; minimum 5) | ||
| Sweden | 20 priced | No official series loaded for this country | ||
US: shrinking packs vs the CPI
230 cases are from the United States. US sources usually record only the size, so this table uses the per-unit rise from the size cut alone (it assumes nothing about the price, and is the minimum rise if the shelf price held). The CPI column is the median 12-month or annual-average change of the matching BLS series at the time of each case. Where US cases also have shelf prices (mostly LendingTree’s 2019/20 vs 2024 Walmart.com comparison), the per-unit change is shown against the CPI over the same years.
| Category | US cases | Size cut alone (median) | US CPI, same time (median) |
|---|---|---|---|
| Chips & Snacks | 21 | +11.1% | +1.8% |
| Toilet Paper | 21 | +11.2% | +10.1% |
| Breakfast Cereals | 20 | +10.0% | +14.2% |
| Health & Supplements | 16 | +25.0% | −0.5% |
| Paper Towels | 16 | +9.8% | +6.9% |
| Laundry | 15 | +11.1% | +3.8% |
| Chocolate & Candy | 14 | +12.4% | +9.7% |
| Soap, Shampoo & Body Wash | 12 | +14.5% | +1.2% |
| Cookies & Crackers | 10 | +12.7% | +9.0% |
| Coffee & Tea | 9 | +14.3% | +8.1% |
| Baking & Spreads | 8 | +15.0% | +2.0% |
| Dish & Cleaning | 8 | +9.6% | +2.1% |
| Juice & Drinks | 8 | +13.5% | +2.2% |
| Oral Care | 7 | +10.8% | +4.1% |
| Frozen Foods | 6 | +25.0% | +3.0% |
| Bags, Foil & Wrap | 5 | +11.8% | +2.2% |
| Diapers & Wipes | 8 | Too few cases with an official match (0) | |
| Pasta, Rice & Meals | 4 | Too few cases with an official match (4) | |
| Bread & Bakery | 3 | Too few cases with an official match (3) | |
| Ice Cream | 3 | Too few cases with an official match (3) | |
| Meat & Fish | 3 | Too few cases with an official match (3) | |
| Pet Food | 3 | Too few cases with an official match (3) | |
| Dairy | 2 | Too few cases with an official match (2) | |
| Deodorant | 2 | Too few cases with an official match (2) | |
| Household | 2 | Too few cases with an official match (2) | |
| Tissues | 2 | Too few cases with an official match (2) | |
| Personal Care | 1 | Too few cases with an official match (1) | |
| Shaving & Razors | 1 | Too few cases with an official match (1) | |
By year
Same measures by the year the pack changed. Comparisons spanning several years (73 cases, e.g. 2019/20 vs 2024) are left out of the monthly and yearly series but kept in the category tables.
| Year | Cases | Priced | Per unit (median) | Official, same cases (n) |
|---|---|---|---|---|
| 2026 (so far) | 294 | 167 | +15.0% | +1.8% (157) |
| 2025 | 224 | 99 | +21.1% | +4.1% (97) |
| 2024 | 206 | 95 | +20.0% | +1.5% (89) |
| 2023 | 191 | 95 | +20.0% | +11.6% (88) |
| 2022 | 139 | 79 | +16.7% | +12.2% (75) |
| 2021 | 56 | 39 | +20.0% | +2.2% (39) |
| 2020 | 50 | 38 | +16.8% | +1.3% (36) |
| 2019 | 15 | 10 | +16.5% | −0.2% (10) |
| 2018 | 27 | 10 | +14.5% | +1.5% (5) |
Changes since the last edition
4 Nov 2026 → 5 Nov 2026. The headline held at +20.0% per unit. What moved: 11 more priced cases with an official match (631 → 642); official inflation for those cases rose from +3.5% to +3.6%; 573 beat official inflation, up from 562 (share still 89%); 13 more cases in the size-cut figure (1,262 → 1,275).
| Figure | 4 Nov | 5 Nov | Change |
|---|---|---|---|
| Per unit (median) | +20.0% | +20.0% | unchanged |
| Official, same cases | +3.5% | +3.6% | +0.1 pt |
| Beat official inflation | 89% 562 of 631 | 89% 573 of 642 | share held +11 cases |
| Priced cases with an official match | 631 | 642 | +11 |
| Cases considered | 1,262 | 1,275 | +13 |
| Size cut alone (median) | +14.3% | +14.3% | unchanged |
Categories that moved 0.5 points or more
- Bread and bakery: per unit +11.6% → +16.0% (+4.4 pt); official held at +1.6%; 10 → 11 priced cases
- Breakfast cereal: per unit held at +25.0%; official +2.0% → +2.6% (+0.6 pt); 34 → 35 priced cases
- Laundry: per unit +13.7% → +14.6% (+0.9 pt); official held at +2.0%; 32 → 33 priced cases
- Pasta, rice and meals: per unit +15.4% → +16.4% (+1.0 pt); official held at −0.7%; 73 → 74 priced cases
- Pet Food: per unit held at +17.6%; official +2.4% → +1.9% (−0.5 pt); 11 → 12 priced cases
More priced cases, figures within 0.5 points: Baking goods and spreads 13 → 14; Chips and snacks 55 → 56; Cookies and crackers 28 → 29; Dish soap and cleaners 18 → 20; Soap, shampoo and body wash 21 → 22.
Editions
Headline figures as published on each build date: priced cases with an official match and their medians.
| Edition | Priced cases | Per unit | Official |
|---|---|---|---|
| 5 Nov 2026 | 642 | +20.0% | +3.6% |
| 4 Nov 2026 | 631 | +20.0% | +3.5% |
| 3 Nov 2026 | 631 | +20.0% | +3.5% |
| 2 Nov 2026 | 627 | +20.0% | +3.5% |
| 1 Nov 2026 | 615 | +20.0% | +3.5% |
| 31 Oct 2026 | 615 | +20.0% | +3.5% |
| 30 Oct 2026 | 615 | +20.0% | +3.5% |
| 29 Oct 2026 | 613 | +20.0% | +3.5% |
| 28 Oct 2026 | 613 | +20.0% | +3.5% |
| 27 Oct 2026 | 606 | +20.0% | +3.5% |
Older editions (2)
| Edition | Priced cases | Per unit | Official |
|---|---|---|---|
| 26 Oct 2026 | 606 | +20.0% | +3.5% |
| 25 Oct 2026 | 606 | +20.0% | +3.6% |
Download the data
- shrinkflation-index.csv: every figure on this page (overall, month, year, category, country, US category), with case counts and a status column (“ok”, or which figure a row has and why the rest is missing: too few cases, size cut only, no official series).
- official-price-indexes.csv: the BLS CPI-U, Eurostat HICP, ONS CPI and Statistics Canada CPI monthly index values and the ABS and Stats NZ CPI quarterly values used.
ShrinkRadar data: quote and cite with credit; no bulk reuse or republishing of the dataset without permission (licence). BLS data is public domain; Eurostat data is reusable with attribution; ONS data is under the Open Government Licence v3.0; ABS data is licensed CC BY 4.0 (source: Australian Bureau of Statistics); Statistics Canada data is used under the Statistics Canada Open Licence (adapted from Table 18-10-0004-01; this does not constitute an endorsement by Statistics Canada); Stats NZ data is licensed CC BY 4.0 (source: Stats NZ). The full case library is on open data.
Method
Basket. Every documented case in our library whose pack changed in 2018 or later: 1,275 cases in 33 categories from 23 countries. 81 older cases are outside the range of the official data we load and are left out; so are 10 restaurant menu items (fast food portions are not packages on a shelf). A case is one product whose pack got smaller, as reported by a consumer agency, advocate or newspaper we link.
Two measures per case. Size cut alone = old size ÷ new size − 1: how much more you pay per unit if the shelf price did not change. Every case has it. Price per unit = (new price ÷ new size) ÷ (old price ÷ old size) − 1, using the shelf prices the source recorded. 683 cases have both prices; 592 are size-only. We never fill in a missing price.
Limits. This is a measure of documented shrinks, not a random sample of products: sources report packs that got smaller and, for the German and Dutch consumer agencies behind most priced cases, usually only when the price per unit rose. So the index shows how big the hidden rise is when shrinkflation happens, not how common it is. The month is when the source reported the change; the old price may be older than a year. Official indexes already count a smaller pack at the same price as a price rise when the item is in their sample (BLS explains how in “Getting less for the same price?”); the gap here shows that shrinking products rise far faster per unit than their category average, not that the CPI ignores shrinkflation. The US GAO estimated that downsizing added less than 0.1 percentage point to overall US consumer prices in 2019–2024, but 1.6 points in cereal and 3.0 points in household paper products (GAO-25-107451).
Full method: official benchmark, weighting, thresholds and data refresh
Official benchmark. Each case is matched to one official series for its category and country (table below). US cases use BLS CPI-U, U.S. city average, not seasonally adjusted; cases from Austria, Germany, Spain, France, Ireland, Italy, Netherlands use Eurostat HICP for that country; UK cases use ONS CPI (index 2015=100, from the MM23 time series); Australian cases use ABS CPI expenditure classes (weighted average of eight capital cities, quarterly: each month takes its quarter’s index, so a 12-month change is the change from the same quarter a year earlier, and a year is compared over the quarters published in both); Canadian cases use Statistics Canada CPI (Table 18-10-0004-01, Canada, not seasonally adjusted); New Zealand cases use Stats NZ CPI (Infoshare quarterly index numbers; each month takes its quarter’s index, so a 12-month change is the change from the same quarter a year earlier). The official change is the 12-month change in the month the case was reported (or the latest published month up to two months earlier); for cases with only a year, the average of that year against the previous year over the months published in both; for sources that state their own comparison period, the change over that period. Cases without a benchmark: no official benchmark loaded for this country: 192; no matching official category: 82; official data not published for that period: 8. Countries without a loaded official series: Brazil, Switzerland, Europe, Hong Kong, Hungary, Israel, India, Japan, South Korea, Sweden.
Weighting. None: every case counts once and we report medians, so one extreme case cannot move a figure much. We have no sales data, so this is not a spending-weighted price index.
Coverage threshold. A month, year or category gets a figure only with at least 5 qualifying cases; otherwise the page says so. 52 months qualify for the per-unit index; 21 categories qualify for the matched comparison.
Last 12 months. The panel’s trailing figure pools the cases reported in the 12 complete calendar months before the current month (Nov 2025–Oct 2026), leaving out comparisons that span more than a year, as the monthly series does; the CSV also gives the 12 months before that (Nov 2024–Oct 2025) for comparison. Both use the same matched official rates as the headline.
Sources and refresh. Series IDs and the category map are in data/bls_series.json; fetch_benchmarks.py downloads them from the BLS public API, the Eurostat API, the ONS MM23 CSV, the ABS Data API, the Statistics Canada Web Data Service and the Stats NZ Infoshare CPI CSV and caches them, and the build recomputes this page from the cache. Official data loaded: BLS to Sep 2026 (fetched 2026-11-03), Eurostat to Sep 2026 (fetched 2026-11-03), ONS to Sep 2026 (fetched 2026-11-03), ABS to Q3 2026 (fetched 2026-11-03; quarterly, so it lags the monthly series), Statistics Canada to Sep 2026 (fetched 2026-11-03), Stats NZ to Q3 2026 (fetched 2026-11-03; quarterly, so it lags the monthly series). BLS did not publish October 2025 (2025 lapse in appropriations); comparisons that need that month use the months that exist.
Official series used
| Official series | Provider | Cases matched |
|---|---|---|
| Chocolate, cocoa and cocoa-based food products DE:CP01185 | Eurostat HICP (DE) | 76 |
| Sugar, jam, honey, syrups, chocolate and confectionery UK:D7DC | ONS CPI (UK) | 50 |
| Macaroni, noodles, couscous and similar pasta products DE:CP01115 | Eurostat HICP (DE) | 49 |
| Processed food excluding alcohol and tobacco DE:FOOD_P_X_ALC_TBC | Eurostat HICP (DE) | 44 |
| Household paper products CUUR0000SEHN02 | BLS CPI-U (US) | 39 |
| Milk, other dairy products and eggs DE:CP0114 | Eurostat HICP (DE) | 38 |
| Other appliances, articles and products for personal care DE:CP1312 | Eurostat HICP (DE) | 36 |
| Household cleaning products CUUR0000SEHN01 | BLS CPI-U (US) | 23 |
| Coffee and coffee substitutes DE:CP0122 | Eurostat HICP (DE) | 23 |
| Household cleaning and maintenance products DE:CP05611 | Eurostat HICP (DE) | 23 |
| Live animals, and meat and other parts of slaughtered land animals DE:CP0112 | Eurostat HICP (DE) | 22 |
| Snacks CUUR0000SEFT03 | BLS CPI-U (US) | 21 |
| Breakfast cereal CUUR0000SEFA02 | BLS CPI-U (US) | 20 |
| Breakfast cereals DE:CP01114 | Eurostat HICP (DE) | 20 |
| Bread and bakery products DE:CP01113 | Eurostat HICP (DE) | 17 |
| Pasta products and couscous UK:L78N | ONS CPI (UK) | 17 |
| Nonprescription drugs CUUR0000SEMF02 | BLS CPI-U (US) | 16 |
| Non-alcoholic beverages DE:CP012 | Eurostat HICP (DE) | 16 |
| Personal care products CUUR0000SEGB | BLS CPI-U (US) | 15 |
| Cleaning and maintenance products UK:L7F8 | ONS CPI (UK) | 15 |
| Candy and chewing gum CUUR0000SEFR02 | BLS CPI-U (US) | 14 |
| Snacks and confectionery AU:115501 | ABS CPI (AU) | 13 |
| Other bakery products UK:L78K | ONS CPI (UK) | 13 |
| Household cleaning and maintenance products AT:CP05611 | Eurostat HICP (AT) | 11 |
| Household cleaning and maintenance products NL:CP05611 | Eurostat HICP (NL) | 11 |
| Bakery products CUUR0000SEFB | BLS CPI-U (US) | 10 |
| Macaroni, noodles, couscous and similar pasta products NL:CP01115 | Eurostat HICP (NL) | 10 |
| Crisps UK:L79R | ONS CPI (UK) | 10 |
| Beverage materials including coffee and tea CUUR0000SEFP | BLS CPI-U (US) | 9 |
| Ready-made food DE:CP01191 | Eurostat HICP (DE) | 9 |
| Products for pets and other household animals DE:CP09322 | Eurostat HICP (DE) | 9 |
| Confectionery, nuts and snacks NZ:CPIQ.SE901305 | Stats NZ CPI (NZ) | 9 |
| Appliances, articles and products for personal care UK:D7EZ | ONS CPI (UK) | 9 |
| Other food at home CUUR0000SAF115 | BLS CPI-U (US) | 8 |
| Juices and nonalcoholic drinks CUUR0000SEFN | BLS CPI-U (US) | 8 |
| Hair, dental, shaving, and miscellaneous personal care products CUUR0000SEGB01 | BLS CPI-U (US) | 8 |
| Other non-durable household goods DE:CP05619 | Eurostat HICP (DE) | 8 |
| Medicines DE:CP0611 | Eurostat HICP (DE) | 8 |
| Bread and bakery products NL:CP01113 | Eurostat HICP (NL) | 8 |
| Chocolate, cocoa and cocoa-based food products NL:CP01185 | Eurostat HICP (NL) | 8 |
| Coffee, tea and cocoa UK:D7DE | ONS CPI (UK) | 8 |
| Products for pets and other household animals AT:CP09322 | Eurostat HICP (AT) | 7 |
| Other appliances, articles and products for personal care AT:CP1312 | Eurostat HICP (AT) | 7 |
| Breakfast cereals AU:40007 | ABS CPI (AU) | 7 |
| Miscellaneous household products CUUR0000SEHN03 | BLS CPI-U (US) | 7 |
| Other appliances, articles and products for personal care NL:CP1312 | Eurostat HICP (NL) | 7 |
| Frozen and freeze dried prepared foods CUUR0000SEFT02 | BLS CPI-U (US) | 6 |
| Milk, cheese and eggs UK:D7D8 | ONS CPI (UK) | 6 |
| Ready-made meals UK:L7A4 | ONS CPI (UK) | 6 |
| Processed food excluding alcohol and tobacco ES:FOOD_P_X_ALC_TBC | Eurostat HICP (ES) | 5 |
| Processed food excluding alcohol and tobacco IT:FOOD_P_X_ALC_TBC | Eurostat HICP (IT) | 5 |
| Milk, other dairy products and eggs NL:CP0114 | Eurostat HICP (NL) | 5 |
| Processed food excluding alcohol and tobacco NL:FOOD_P_X_ALC_TBC | Eurostat HICP (NL) | 5 |
| Meat UK:D7D6 | ONS CPI (UK) | 5 |
| Other food products and non-alcoholic beverages CA:v41691029 | StatCan CPI (CA) | 4 |
| Rice, pasta, cornmeal CUUR0000SEFA03 | BLS CPI-U (US) | 4 |
| Ice, ice cream and sorbets DE:CP01186 | Eurostat HICP (DE) | 4 |
| Processed food excluding alcohol and tobacco FR:FOOD_P_X_ALC_TBC | Eurostat HICP (FR) | 4 |
| Other appliances, articles and products for personal care IT:CP1312 | Eurostat HICP (IT) | 4 |
| Breakfast cereals and other cereal products UK:L78O | ONS CPI (UK) | 4 |
| Products for pets UK:L7HG | ONS CPI (UK) | 4 |
| Other non-durable household goods AT:CP05619 | Eurostat HICP (AT) | 3 |
| Food and non-alcoholic beverages AU:20001 | ABS CPI (AU) | 3 |
| Cakes and biscuits AU:40006 | ABS CPI (AU) | 3 |
| Meats, poultry, and fish CUUR0000SAF1121 | BLS CPI-U (US) | 3 |
| Bread CUUR0000SEFB01 | BLS CPI-U (US) | 3 |
| Ice cream and related products CUUR0000SEFJ03 | BLS CPI-U (US) | 3 |
| Pet food and treats CUUR0000SS61031 | BLS CPI-U (US) | 3 |
| Breakfast cereals FR:CP01114 | Eurostat HICP (FR) | 3 |
| Products for pets and other household animals FR:CP09322 | Eurostat HICP (FR) | 3 |
| Milk, other dairy products and eggs IT:CP0114 | Eurostat HICP (IT) | 3 |
| Breakfast cereals NL:CP01114 | Eurostat HICP (NL) | 3 |
| Ready-made food NL:CP01191 | Eurostat HICP (NL) | 3 |
| Coffee and coffee substitutes NL:CP0122 | Eurostat HICP (NL) | 3 |
| Bread and cereals UK:D7D5 | ONS CPI (UK) | 3 |
| Mineral waters, soft drinks and juices UK:D7DF | ONS CPI (UK) | 3 |
| Coffee and coffee substitutes AT:CP0122 | Eurostat HICP (AT) | 2 |
| Cleaning and maintenance products AU:40067 | ABS CPI (AU) | 2 |
| Ice cream and related products CA:v41690997 | StatCan CPI (CA) | 2 |
| Pasta products CA:v41691008 | StatCan CPI (CA) | 2 |
| Confectionery CA:v41691032 | StatCan CPI (CA) | 2 |
| Dairy and related products CUUR0000SEFJ | BLS CPI-U (US) | 2 |
| Baby food DE:CP01192 | Eurostat HICP (DE) | 2 |
| Live animals, and meat and other parts of slaughtered land animals ES:CP0112 | Eurostat HICP (ES) | 2 |
| Live animals, and meat and other parts of slaughtered land animals FR:CP0112 | Eurostat HICP (FR) | 2 |
| Milk, other dairy products and eggs FR:CP0114 | Eurostat HICP (FR) | 2 |
| Ice, ice cream and sorbets IT:CP01186 | Eurostat HICP (IT) | 2 |
| Household cleaning and maintenance products IT:CP05611 | Eurostat HICP (IT) | 2 |
| Ice, ice cream and sorbets NL:CP01186 | Eurostat HICP (NL) | 2 |
| Food UK:D7C8 | ONS CPI (UK) | 2 |
| Breakfast cereals AT:CP01114 | Eurostat HICP (AT) | 1 |
| Milk, other dairy products and eggs AT:CP0114 | Eurostat HICP (AT) | 1 |
| Ready-made food AT:CP01191 | Eurostat HICP (AT) | 1 |
| Medicines AT:CP0611 | Eurostat HICP (AT) | 1 |
| Processed food excluding alcohol and tobacco AT:FOOD_P_X_ALC_TBC | Eurostat HICP (AT) | 1 |
| Dairy and related products AU:30001 | ABS CPI (AU) | 1 |
| Other cereal products AU:40008 | ABS CPI (AU) | 1 |
| Personal care products AU:40095 | ABS CPI (AU) | 1 |
| Potato chips and other snack products n.e.c. (2013=100) CA:v122665883 | StatCan CPI (CA) | 1 |
| Cookies and crackers CA:v41691003 | StatCan CPI (CA) | 1 |
| Breakfast cereal and other cereal products (excluding baby food) CA:v41691007 | StatCan CPI (CA) | 1 |
| Bread and bakery products ES:CP01113 | Eurostat HICP (ES) | 1 |
| Breakfast cereals ES:CP01114 | Eurostat HICP (ES) | 1 |
| Milk, other dairy products and eggs ES:CP0114 | Eurostat HICP (ES) | 1 |
| Non-alcoholic beverages ES:CP012 | Eurostat HICP (ES) | 1 |
| Coffee and coffee substitutes ES:CP0122 | Eurostat HICP (ES) | 1 |
| Household cleaning and maintenance products ES:CP05611 | Eurostat HICP (ES) | 1 |
| Other appliances, articles and products for personal care ES:CP1312 | Eurostat HICP (ES) | 1 |
| Ready-made food FR:CP01191 | Eurostat HICP (FR) | 1 |
| Non-alcoholic beverages FR:CP012 | Eurostat HICP (FR) | 1 |
| Other appliances, articles and products for personal care FR:CP1312 | Eurostat HICP (FR) | 1 |
| Chocolate, cocoa and cocoa-based food products IE:CP01185 | Eurostat HICP (IE) | 1 |
| Chocolate, cocoa and cocoa-based food products IT:CP01185 | Eurostat HICP (IT) | 1 |
| Baby food NL:CP01192 | Eurostat HICP (NL) | 1 |
| Non-alcoholic beverages NL:CP012 | Eurostat HICP (NL) | 1 |
| Other non-durable household goods NL:CP05619 | Eurostat HICP (NL) | 1 |
| Milk, cheese and eggs NZ:CPIQ.SE901302 | Stats NZ CPI (NZ) | 1 |
| Soft drinks, waters and juices NZ:CPIQ.SE901402 | Stats NZ CPI (NZ) | 1 |
| Cleaning products and other household supplies NZ:CPIQ.SE905601 | Stats NZ CPI (NZ) | 1 |
| Food products n.e.c. UK:D7DD | ONS CPI (UK) | 1 |
| Pharmaceutical products UK:D7F7 | ONS CPI (UK) | 1 |
| Edible ices and ice cream UK:L7A2 | ONS CPI (UK) | 1 |
| Other non-durable small household articles UK:L7F9 | ONS CPI (UK) | 1 |
Embed the index
Put the live headline on your site or article. The card updates whenever we rebuild the index and links back to this page and the method. Free to use; please keep the links.
Embed code
Cite the index
ShrinkRadar, “ShrinkRadar Index: hidden inflation in shrinking packs”, edition of 5 November 2026 (+20.0% per unit vs +3.6% official inflation, median of 642 priced cases with an official match), https://shrinkradar.com/shrinkflation-index/, accessed 2026-11-05. Data: ShrinkRadar case library; U.S. Bureau of Labor Statistics CPI-U; Eurostat HICP; Office for National Statistics CPI (Open Government Licence v3.0); Australian Bureau of Statistics CPI (CC BY 4.0); Statistics Canada CPI, Table 18-10-0004-01 (Statistics Canada Open Licence); Stats NZ CPI (CC BY 4.0).
Related: shrinkflation statistics · charts to share · biggest hidden price hikes · shrinkflation calculator · all cases.