Bread and bakery hidden inflation: +16.0% per unit vs +1.6% official inflation
By ShrinkRadar · Updated 2026-11-05 · Part of the ShrinkRadar Index, recomputed from the case library and official price data on every build
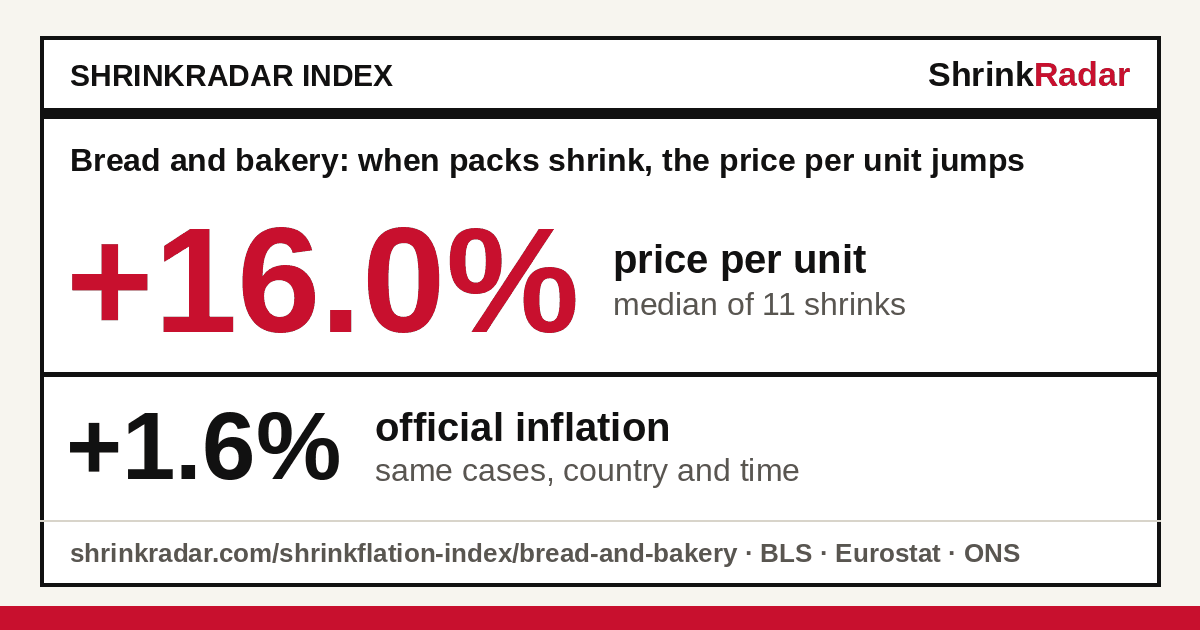
When a bread and bakery pack shrinks, its price per unit jumps. In 11 documented bread and bakery shrinks with shelf prices before and after and an official match (2023–2026), the median price per unit changed +16.0%. Official inflation for the same cases, matched to each one’s category, country and time, was +1.6%: official prices up 1.6%, the ShrinkRadar per-unit price up 16.0% over the same periods.
same category, country and time+1.6%
10 of 1191%
shelf prices before and after11
median, all 14 cases since 2018+18.7%
Official data: U.S. Bureau of Labor Statistics CPI-U, Eurostat HICP, Office for National Statistics CPI. Recomputed on every build. Method and limits.
In one lineBy countryBy yearCasesOfficial seriesMethodCite
Bread and bakery in one line
Each line is computed from the tables below. Copy one with its source.
Bread and bakery: official prices were up 1.6% and the ShrinkRadar per-unit price up 16.0% over the same periods. Packs that shrank cost a median 16.0% more per unit than the pack they replaced, against 1.6% official inflation for the same category, country and time (11 priced cases with an official match, 2023–2026).
In 91% of those bread and bakery cases (10 of 11), the price per unit rose more than official inflation for the same category, country and time.
Across all 14 documented bread and bakery shrinks since 2018, the size cut alone raised the price per unit by a median 18.7%, before any change in the shelf price.
In Germany, bread and bakery packs that shrank were up 6.5% per gram, while official prices (Eurostat HICP) for the same cases were up 1.6% over the same periods (5 priced cases with an official match, 2023–2026, all from Verbraucherzentrale Hamburg).
By country
The same comparison for bread and bakery cases by the country they come from, each against its own statistics office. A country needs at least 5 priced cases with an official match; 4 of 5 countries have fewer, and the table says so instead of showing a figure.
| Country | Cases | Per unit (median) | Official, same cases | |
|---|---|---|---|---|
| Germany | 5 (5 priced) | +6.5% | +1.6% | |
| United Kingdom | 3 (3 priced) | Too thin: 3 priced cases with an official match (minimum 5) | ||
| Netherlands | 2 (2 priced) | Too thin: 2 priced cases with an official match (minimum 5) | ||
| Spain | 1 (1 priced) | Too thin: 1 priced case with an official match (minimum 5) | ||
| United States | 3 (0 priced) | Too thin: 0 priced cases with an official match (minimum 5) | ||
By year
By the year the pack changed. A year needs at least 5 priced cases; thin years are marked. Comparisons spanning several years (1 bread and bakery cases) are left out of this series but kept in the headline and the case list.
| Year | Cases | Priced | Per unit (median) | Official, same cases (n) |
|---|---|---|---|---|
| 2026 (so far) | 7 | 5 | +16.0% | +1.5% (5) |
| 2025 | 3 | 3 | too thin | — |
| 2024 | 1 | 0 | too thin | — |
| 2023 | 2 | 2 | too thin | — |
The 14 bread and bakery cases
Which cases count. All 14 bread and bakery cases that changed in 2018 or later are listed and count in the size-cut figure. The per-unit headline uses the 11 that have shelf prices before and after and an official match (listed first). Left out of the per-unit figure: 3 size-only cases (the source recorded no shelf prices; we never fill one in).
| Case (country · when · size) | Per unit | Official, matched |
|---|---|---|
| AH crème brûlée flap Netherlands · 2026 · 110 g → 105 g (−4.5%) | +4.8% | +2.2% Bread and bakery products · Eurostat HICP (NL) · 12 months to Mar 2026 |
| GAIL's challah knots, 2 pack (Waitrose) United Kingdom · 2026 · 220 g → 166 g (−24.5%) | +32.5% | +0.8% Bread and cereals · ONS CPI (UK) · 12 months to May 2026 · broad match |
| Mr Kipling Signature salted caramel brownie bites (UK) United Kingdom · 2026 · 10 cakes → 8 cakes (−20.0%) | +25.0% | +0.6% Bread and cereals · ONS CPI (UK) · 12 months to Jun 2026 · broad match |
| Rewe frei von Landbrot Germany · 2026 · 400 g → 250 g (−37.5%) | +6.5% | +1.5% Bread and bakery products · Eurostat HICP (DE) · 12 months to May 2026 |
| Waitrose rhubarb crumbles, 2-pack (UK) United Kingdom · 2026 · 290 g → 250 g (−13.8%) | +16.0% | +1.5% Bread and cereals · ONS CPI (UK) · 12 months to Sep 2026 · broad match |
| Gourmet Eierlikör-Sahnetorte Germany · 2025 · 880 g → 700 g (−20.5%) | +4.7% | +1.2% Bread and bakery products · Eurostat HICP (DE) · 12 months to Jun 2025 |
| Honig Mexicaanse Wraps Netherlands · 2025 · 305 g → 265 g (−13.1%) | +25.3% | +2.6% Bread and bakery products · Eurostat HICP (NL) · 2025 average vs 2024 |
| Matzen Germany · 2025 · 260 g → 180 g (−30.8%) | +5.8% | +1.6% Bread and bakery products · Eurostat HICP (DE) · 12 months to Aug 2025 |
| Aldi gourmet baguette with olive oil (Spain) Spain · 2022–2023 · 300 g → 260 g (−13.3%) | +54.3% | +19.4% Bread and bakery products · Eurostat HICP (ES) · 12 months to Feb 2023 |
| Knack & Back Knoblauch-Ecken Germany · 2023 · 340 g → 280 g (−17.6%) | +21.4% | +9.0% Bread and bakery products · Eurostat HICP (DE) · 12 months to Nov 2023 |
| Rewe Bio Mehrkorn Landbrötchen Germany · 2023 · 300 g → 280 g (−6.7%) | +7.1% | +23.8% Bread and bakery products · Eurostat HICP (DE) · 12 months to Feb 2023 |
| Thomas' Bagels United States · 2026 · 22 oz → 20 oz (−9.1%) | size only size cut alone +10.0% | +3.9% Bread · BLS CPI-U (US) · 12 months to Jun 2026 |
| Thomas' Bagels 6-pack United States · 2026 · 20 oz → 18 oz (−10.0%) | size only size cut alone +11.1% | +3.6% Bread · BLS CPI-U (US) · 2026 average vs 2025 (same 9 months) |
| Mission Carb Balance whole wheat tortillas United States · 2024 · 8 tortillas → 6 tortillas (−25.0%) | size only size cut alone +33.3% | −0.2% Bread · BLS CPI-U (US) · 12 months to Aug 2024 |
Official series used
Each bread and bakery case is matched to one official series for its country. A broad match means no series exists for exactly this category, so the nearest wider one is used.
| Official series | Provider | Cases matched |
|---|---|---|
| Bread and bakery products DE:CP01113 | Eurostat HICP (DE) | 5 |
| Bread CUUR0000SEFB01 | BLS CPI-U (US) | 3 |
| Bread and cereals UK:D7D5 · broad match | ONS CPI (UK) | 3 |
| Bread and bakery products NL:CP01113 | Eurostat HICP (NL) | 2 |
| Bread and bakery products ES:CP01113 | Eurostat HICP (ES) | 1 |
Method and limits
Two measures per case. Size cut alone = old size ÷ new size − 1: what you pay more per unit if the shelf price did not change. Price per unit = (new price ÷ new size) ÷ (old price ÷ old size) − 1, from the shelf prices the source recorded. Official benchmark: the 12-month change of the matched series in the month the case was reported, or the annual-average change for cases with only a year, or the source’s own comparison period. Every case counts once and figures are medians; there is no spending weighting.
Limits. These are documented shrinks, not a random sample: sources report packs that got smaller, and the consumer agencies behind most priced cases usually report them when the price per unit rose. So the page shows how big the hidden rise is when bread and bakery shrinkflation happens, not how common it is. Official indexes already count a smaller pack at the same price as a price rise when the item is in their sample. Full method, thresholds and data refresh: ShrinkRadar Index method.
Cite this page
ShrinkRadar, “ShrinkRadar Index: bread and bakery hidden inflation”, https://shrinkradar.com/shrinkflation-index/bread-and-bakery/, accessed 2026-11-05. Data: ShrinkRadar case library; U.S. Bureau of Labor Statistics CPI-U; Eurostat HICP; Office for National Statistics CPI (Open Government Licence v3.0).
More on bread and bakery
- ShrinkRadar Index: all categories →Every category, country, month and year, with CSV downloads.
- All Bread & Bakery cases and tracked products →Size Facts, brands caught most often and products we check daily.
- shrinkflation-index.csv →Every Index figure, including this category, with case counts and a status column for thin rows.
Other categories in the Index
- Chocolate and candy +20.0% vs +8.7%
- Pasta, rice and meals +16.4% vs −0.7%
- Chips and snacks +19.5% vs +4.7%
- Dairy +11.1% vs +4.8%
- Breakfast cereal +25.0% vs +2.6%
- Laundry +14.5% vs +2.0%
- Coffee and tea +25.0% vs +11.6%
- Cookies and crackers +21.2% vs +1.3%
- Meat and fish +19.3% vs +3.0%
- Personal Care +27.9% vs +1.6%
- Soap, shampoo and body wash +21.4% vs +1.9%
- Dish soap and cleaners +11.1% vs +1.7%
- Juice and soft drinks +33.2% vs +5.0%
- Frozen Foods +16.9% vs +3.8%
- Baking goods and spreads +25.1% vs +2.8%
- Pet Food +17.6% vs +1.9%
- Toilet Paper +29.4% vs +28.8%
- Health and supplements +15.2% vs +3.2%
- Ice Cream +9.5% vs +6.6%
- Paper Towels +25.8% vs +28.8%
Closest to a figure (priced cases with an official match now, of 5 needed): Baby 4, needs 1 more; Household 4, needs 1 more; Oral Care 4, needs 1 more; Tissues 4, needs 1 more; Feminine Care 3, needs 2 more; Shaving & Razors 2, needs 3 more; Cat Litter & Pet Supplies 1, needs 4 more; Deodorant 1, needs 4 more; Bags, Foil & Wrap 0, needs 5 more.