Toilet paper hidden inflation: +29.4% per unit vs +28.8% official inflation
By ShrinkRadar · Updated 2026-11-05 · Part of the ShrinkRadar Index, recomputed from the case library and official price data on every build
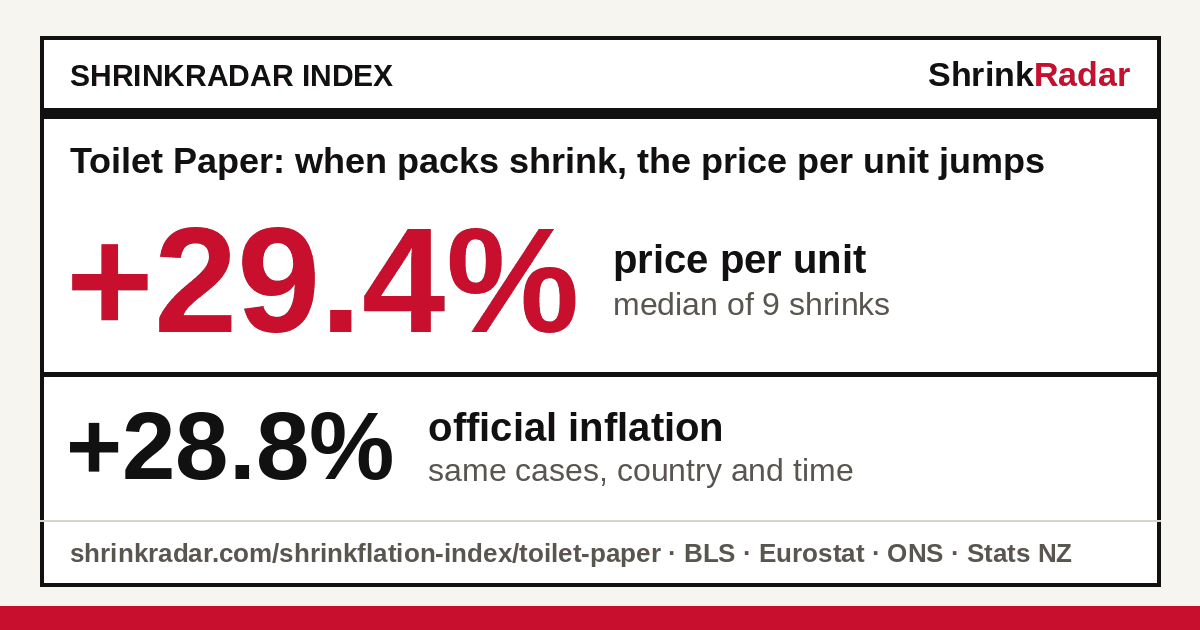
When a toilet paper pack shrinks, its price per unit jumps. In 9 documented toilet paper shrinks with shelf prices before and after and an official match (2020–2024), the median price per unit changed +29.4%. Official inflation for the same cases, matched to each one’s category, country and time, was +28.8%: official prices up 28.8%, the ShrinkRadar per-unit price up 29.4% over the same periods.
same category, country and time+28.8%
7 of 978%
shelf prices before and after9
median, all 28 cases since 2018+12.4%
Official data: U.S. Bureau of Labor Statistics CPI-U, Eurostat HICP, Office for National Statistics CPI, Stats NZ CPI. Recomputed on every build. Method and limits.
In one lineBy countryBy yearCasesOfficial seriesMethodCite
Toilet paper in one line
Each line is computed from the tables below. Copy one with its source.
Toilet paper: official prices were up 28.8% and the ShrinkRadar per-unit price up 29.4% over the same periods. Packs that shrank cost a median 29.4% more per unit than the pack they replaced, against 28.8% official inflation for the same category, country and time (9 priced cases with an official match, 2020–2024, mostly from LendingTree shrinkflation study).
In 78% of those toilet paper cases (7 of 9), the price per unit rose more than official inflation for the same category, country and time.
Across all 28 documented toilet paper shrinks since 2018, the size cut alone raised the price per unit by a median 12.4%, before any change in the shelf price.
In the United States, toilet paper packs that shrank were up 30.4% per sheet, while official prices (BLS CPI-U) for the same cases were up 28.8% over the same periods (6 priced cases with an official match, 2024, all from LendingTree shrinkflation study).
By country
The same comparison for toilet paper cases by the country they come from, each against its own statistics office. A country needs at least 5 priced cases with an official match; 4 of 5 countries have fewer, and the table says so instead of showing a figure.
| Country | Cases | Per unit (median) | Official, same cases | |
|---|---|---|---|---|
| United States | 21 (6 priced) | +30.4% | +28.8% | |
| Germany | 3 (3 priced) | Too thin: 3 priced cases with an official match (minimum 5) | ||
| Austria | 2 (0 priced) | Too thin: 0 priced cases with an official match (minimum 5) | ||
| New Zealand | 1 (0 priced) | Too thin: 0 priced cases with an official match (minimum 5) | ||
| United Kingdom | 1 (0 priced) | Too thin: 0 priced cases with an official match (minimum 5) | ||
By year
By the year the pack changed. A year needs at least 5 priced cases; thin years are marked. Comparisons spanning several years (6 toilet paper cases) are left out of this series but kept in the headline and the case list. No single year has 5 priced toilet paper cases yet, so there is no yearly figure.
| Year | Cases | Priced | Per unit (median) | Official, same cases (n) |
|---|---|---|---|---|
| 2026 (so far) | 1 | 0 | too thin | — |
| 2025 | 2 | 0 | too thin | — |
| 2024 | 2 | 0 | too thin | — |
| 2023 | 4 | 0 | too thin | — |
| 2022 | 6 | 0 | too thin | — |
| 2021 | 3 | 2 | too thin | — |
| 2020 | 2 | 1 | too thin | — |
| 2018 | 2 | 0 | too thin | — |
The 28 toilet paper cases
Which cases count. All 28 toilet paper cases that changed in 2018 or later are listed and count in the size-cut figure. The per-unit headline uses the 9 that have shelf prices before and after and an official match (listed first). Left out of the per-unit figure: 19 size-only cases (the source recorded no shelf prices; we never fill one in). Not listed: 6 older toilet paper cases that changed before 2018, outside the range of the official data.
| Case (country · when · size) | Per unit | Official, matched |
|---|---|---|
| Angel Soft toilet paper, 12 mega rolls United States · 2024 · 429 sheets/roll → 320 sheets/roll (−25.4%) | +13.5% | +28.8% Household paper products · BLS CPI-U (US) · 2024 average vs 2019–2020 average |
| Charmin Ultra Soft toilet paper, 12 mega rolls United States · 2024 · 284 sheets/roll → 244 sheets/roll (−14.1%) | +34.3% | +28.8% Household paper products · BLS CPI-U (US) · 2024 average vs 2019–2020 average |
| Charmin Ultra Strong toilet paper, 24 mega rolls United States · 2024 · 286 sheets/roll → 242 sheets/roll (−15.4%) | +31.4% | +28.8% Household paper products · BLS CPI-U (US) · 2024 average vs 2019–2020 average |
| Cottonelle Ultra Comfort toilet paper, 12 mega rolls United States · 2024 · 284 sheets/roll → 244 sheets/roll (−14.1%) | +21.1% | +28.8% Household paper products · BLS CPI-U (US) · 2024 average vs 2019–2020 average |
| Great Value Ultra Strong toilet paper, 12 mega rolls United States · 2024 · 286 sheets/roll → 242 sheets/roll (−15.4%) | +37.5% | +28.8% Household paper products · BLS CPI-U (US) · 2024 average vs 2019–2020 average |
| Quilted Northern Ultra Plush toilet paper, 18 mega rolls United States · 2024 · 308 sheets/roll → 255 sheets/roll (−17.2%) | +29.4% | +28.8% Household paper products · BLS CPI-U (US) · 2024 average vs 2019–2020 average |
| Alouette Feuchtes Toilettenpapier Deluxe Germany · 2021 · 60 pieces → 50 pieces (−16.7%) | +20.0% | +0.4% Other non-durable household goods · Eurostat HICP (DE) · 12 months to May 2021 · broad match |
| Penny Happy End Feuchtes Toilettenpapier Germany · 2021 · 60 pieces → 50 pieces (−16.7%) | +20.0% | +1.0% Other non-durable household goods · Eurostat HICP (DE) · 12 months to Feb 2021 · broad match |
| Sensitiv Feuchtes Toilettenpapier Germany · 2020 · 60 pieces → 42 pieces (−30.0%) | +53.4% | −1.4% Other non-durable household goods · Eurostat HICP (DE) · 12 months to Jul 2020 · broad match |
| Quilted Northern Mega Roll United States · 2026 · 295 sheets/roll → 255 sheets/roll (−13.6%) | size only size cut alone +15.7% | +0.9% Household paper products · BLS CPI-U (US) · 2026 average vs 2025 (same 9 months) |
| Charmin Ultra Soft Mega Roll (2025) United States · 2025 · 224 sheets/roll → 208 sheets/roll (−7.1%) | size only size cut alone +7.7% | +2.0% Household paper products · BLS CPI-U (US) · 2025 average vs 2024 (same 11 months) |
| Purex Mega Long toilet paper (New Zealand) New Zealand · 2025 · 450 sheets/roll → 410 sheets/roll (−8.9%) | size only size cut alone +9.8% | +0.3% Cleaning products and other household supplies · Stats NZ CPI (NZ) · 12 months to Feb 2026 · broad match |
| Charmin Ultra Strong Mega XL roll (was Super Mega) United States · 2024 · 363 sheets/roll → 330 sheets/roll (−9.1%) | size only size cut alone +10.0% | +0.1% Household paper products · BLS CPI-U (US) · 12 months to Dec 2024 |
| Cottonelle Ultra Clean toilet paper United States · 2024 · 321 sheets/roll → 284 sheets/roll (−11.5%) | size only size cut alone +13.0% | +0.7% Household paper products · BLS CPI-U (US) · 12 months to Apr 2024 |
| Andrex Classic Clean Washlets wipes United Kingdom · 2023 · 40 wipes → 36 wipes (−10.0%) | size only size cut alone +11.1% | +9.8% Other non-durable small household articles · ONS CPI (UK) · 2023 average vs 2022 · broad match |
| Hakle Pflegende Sauberkeit toilet paper (Austria) Austria · 2023 · 10 rolls → 8 rolls (−20.0%) | size only size cut alone +25.0% | +2.6% Other non-durable household goods · Eurostat HICP (AT) · 12 months to Oct 2024 · broad match |
| Quilted Northern Toilet Tissue United States · 2023 · 328 sheets → 295 sheets (−10.1%) | size only size cut alone +11.2% | +6.5% Household paper products · BLS CPI-U (US) · 12 months to Sep 2023 |
| Zewa Comfort toilet paper, large pack (Austria) Austria · 2023 · 20 rolls → 16 rolls (−20.0%) | size only size cut alone +25.0% | +2.6% Other non-durable household goods · Eurostat HICP (AT) · 12 months to Oct 2024 · broad match |
| Angel Soft Toilet Paper United States · 2022 · 425 sheets → 320 sheets (−24.7%) | size only size cut alone +32.8% | +9.4% Household paper products · BLS CPI-U (US) · 12 months to Jun 2022 |
| Charmin Ultra Soft Mega Roll United States · 2022 · 264 sheets/roll → 244 sheets/roll (−7.6%) | size only size cut alone +8.2% | +10.1% Household paper products · BLS CPI-U (US) · 2022 average vs 2021 |
| Charmin Ultra Soft Super Mega Roll United States · 2022 · 396 sheets/roll → 366 sheets/roll (−7.6%) | size only size cut alone +8.2% | +10.1% Household paper products · BLS CPI-U (US) · 2022 average vs 2021 |
| Charmin Ultra Strong Mega Rolls United States · 2022 · 264 sheets → 242 sheets (−8.3%) | size only size cut alone +9.1% | +12.4% Household paper products · BLS CPI-U (US) · 12 months to Sep 2022 |
| Cottonelle Mega Roll (1-ply) United States · 2022 · 340 sheets/roll → 312 sheets/roll (−8.2%) | size only size cut alone +9.0% | +10.1% Household paper products · BLS CPI-U (US) · 2022 average vs 2021 |
| Cottonelle Mega Roll (2-ply) United States · 2022 · 284 sheets/roll → 268 sheets/roll (−5.6%) | size only size cut alone +6.0% | +10.1% Household paper products · BLS CPI-U (US) · 2022 average vs 2021 |
| Costco-Kirkland Toilet Paper United States · 2021 · 425 sheets → 380 sheets (−10.6%) | size only size cut alone +11.8% | +0.3% Household paper products · BLS CPI-U (US) · 12 months to Aug 2021 |
| Charmin Ultra Strong United States · 2020 · 286 sheets → 264 sheets (−7.7%) | size only size cut alone +8.3% | +7.7% Household paper products · BLS CPI-U (US) · 12 months to Dec 2020 |
| Charmin United States · 2018 · 308 sheets → 286 sheets (−7.1%) | size only size cut alone +7.7% | +3.8% Household paper products · BLS CPI-U (US) · 12 months to Dec 2018 |
| Quilted Northern United States · 2018 · 330 sheets → 308 sheets (−6.7%) | size only size cut alone +7.1% | −0.6% Household paper products · BLS CPI-U (US) · 12 months to Apr 2018 |
Official series used
Each toilet paper case is matched to one official series for its country. A broad match means no series exists for exactly this category, so the nearest wider one is used.
| Official series | Provider | Cases matched |
|---|---|---|
| Household paper products CUUR0000SEHN02 | BLS CPI-U (US) | 21 |
| Other non-durable household goods DE:CP05619 · broad match | Eurostat HICP (DE) | 3 |
| Other non-durable household goods AT:CP05619 · broad match | Eurostat HICP (AT) | 2 |
| Cleaning products and other household supplies NZ:CPIQ.SE905601 · broad match | Stats NZ CPI (NZ) | 1 |
| Other non-durable small household articles UK:L7F9 · broad match | ONS CPI (UK) | 1 |
Method and limits
Two measures per case. Size cut alone = old size ÷ new size − 1: what you pay more per unit if the shelf price did not change. Price per unit = (new price ÷ new size) ÷ (old price ÷ old size) − 1, from the shelf prices the source recorded. Official benchmark: the 12-month change of the matched series in the month the case was reported, or the annual-average change for cases with only a year, or the source’s own comparison period. Every case counts once and figures are medians; there is no spending weighting.
Limits. These are documented shrinks, not a random sample: sources report packs that got smaller, and the consumer agencies behind most priced cases usually report them when the price per unit rose. So the page shows how big the hidden rise is when toilet paper shrinkflation happens, not how common it is. Official indexes already count a smaller pack at the same price as a price rise when the item is in their sample. Full method, thresholds and data refresh: ShrinkRadar Index method.
Cite this page
ShrinkRadar, “ShrinkRadar Index: toilet paper hidden inflation”, https://shrinkradar.com/shrinkflation-index/toilet-paper/, accessed 2026-11-05. Data: ShrinkRadar case library; U.S. Bureau of Labor Statistics CPI-U; Eurostat HICP; Office for National Statistics CPI (Open Government Licence v3.0); Stats NZ CPI (CC BY 4.0).
More on toilet paper
- ShrinkRadar Index: all categories →Every category, country, month and year, with CSV downloads.
- Toilet paper shrinkflation →Every documented case in one place, brand by brand.
- All Toilet Paper cases and tracked products →Size Facts, brands caught most often and products we check daily.
- shrinkflation-index.csv →Every Index figure, including this category, with case counts and a status column for thin rows.
Other categories in the Index
- Chocolate and candy +20.0% vs +8.7%
- Pasta, rice and meals +16.4% vs −0.7%
- Chips and snacks +19.5% vs +4.7%
- Dairy +11.1% vs +4.8%
- Breakfast cereal +25.0% vs +2.6%
- Laundry +14.5% vs +2.0%
- Coffee and tea +25.0% vs +11.6%
- Cookies and crackers +21.2% vs +1.3%
- Meat and fish +19.3% vs +3.0%
- Personal Care +27.9% vs +1.6%
- Soap, shampoo and body wash +21.4% vs +1.9%
- Dish soap and cleaners +11.1% vs +1.7%
- Juice and soft drinks +33.2% vs +5.0%
- Frozen Foods +16.9% vs +3.8%
- Baking goods and spreads +25.1% vs +2.8%
- Pet Food +17.6% vs +1.9%
- Bread and bakery +16.0% vs +1.6%
- Health and supplements +15.2% vs +3.2%
- Ice Cream +9.5% vs +6.6%
- Paper Towels +25.8% vs +28.8%
Closest to a figure (priced cases with an official match now, of 5 needed): Baby 4, needs 1 more; Household 4, needs 1 more; Oral Care 4, needs 1 more; Tissues 4, needs 1 more; Feminine Care 3, needs 2 more; Shaving & Razors 2, needs 3 more; Cat Litter & Pet Supplies 1, needs 4 more; Deodorant 1, needs 4 more; Bags, Foil & Wrap 0, needs 5 more.